CurrentSky · GenAI Academy Hackathon
Visualized Infrastructure & Behavioral Engine
An AI digital twin of a city’s health — spotting where neighborhoods start to decline before the damage spreads.
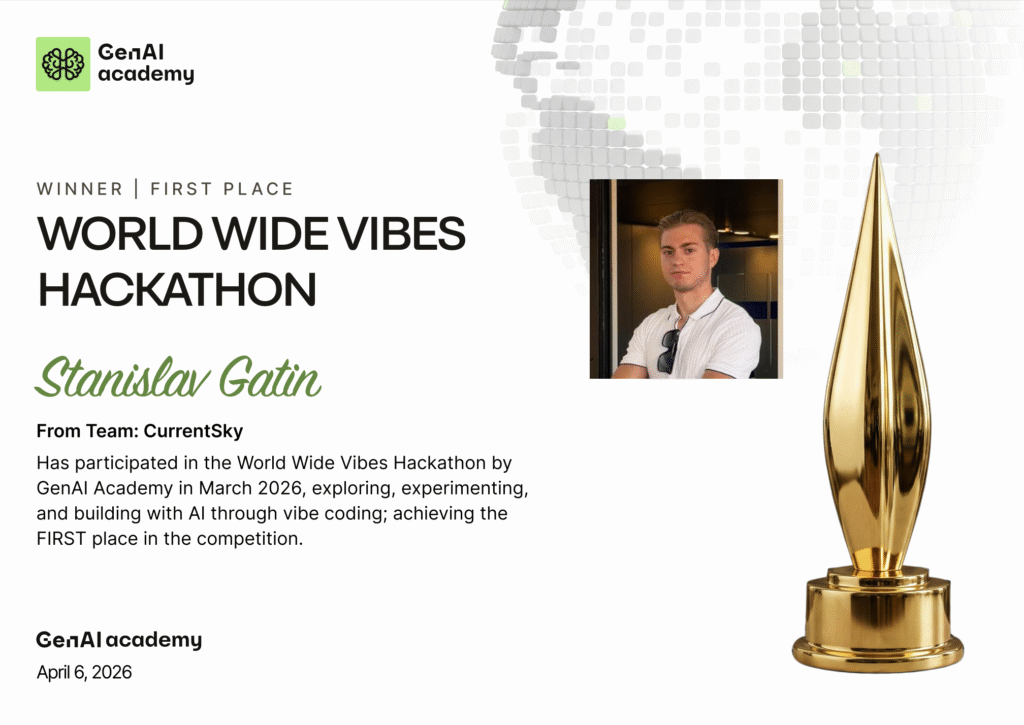
The hackathon by the numbers
First out of 350+ teams
V.I.B.E. won 1st place at the World Wide Vibes Hackathon, a global GenAI Academy event that drew thousands of builders from over a hundred countries.
What the judge said
“A real master class”
“The crazy cool part about V.I.B.E. is that so many people tackled this use case — and to mix the right recipe of graphics, using the maps with the right overlay that’s not overwhelming, insightful but with actionable modes and buttons… this was a real master class.”
“Whenever you’re in a hot, competitive use case, it’s hard to rise above — and they truly did. This wasn’t just visual; this was a powerful implementation.”
The problem
Cities react too late
Modern cities struggle with urban blight — the gradual, visible decline of neighborhoods that drags down property values, raises crime, and erodes quality of life. Traditional municipal management leans on historical data like 311 requests and code violations.
That creates a “lag-time” problem: officials only react after a problem is already visible and residents have grown frustrated. By the time the data shows it, trust is already gone.
The solution
A digital twin of urban health
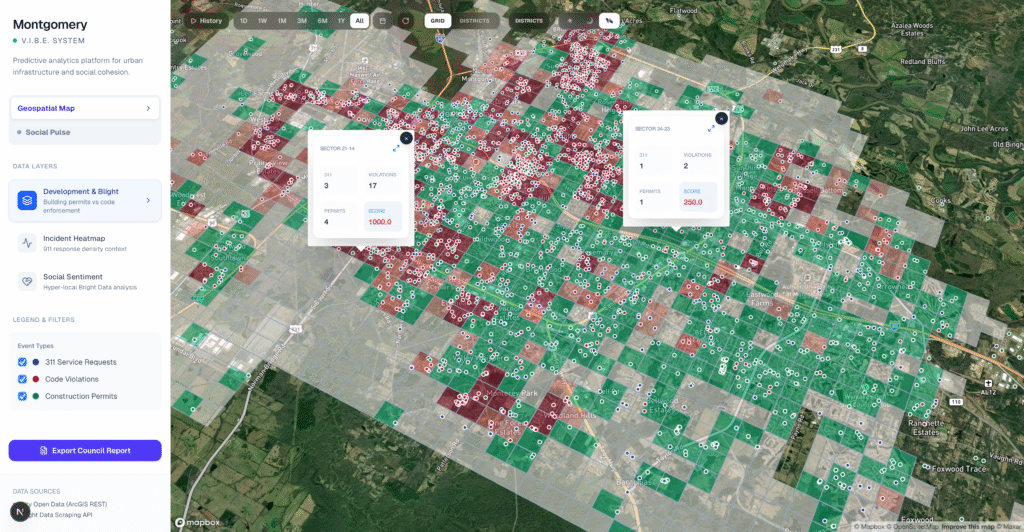
V.I.B.E. bridges official city data and real-time behavioral sentiment into one predictive model for urban maintenance.
By synchronizing Mapbox-powered geospatial intelligence with hyper-local data scraping (Bright Data), V.I.B.E. finds high-risk areas where citizen frustration is rising faster than municipal response — enabling preemptive intervention.
How it reads the city
Three map analysis layers
01
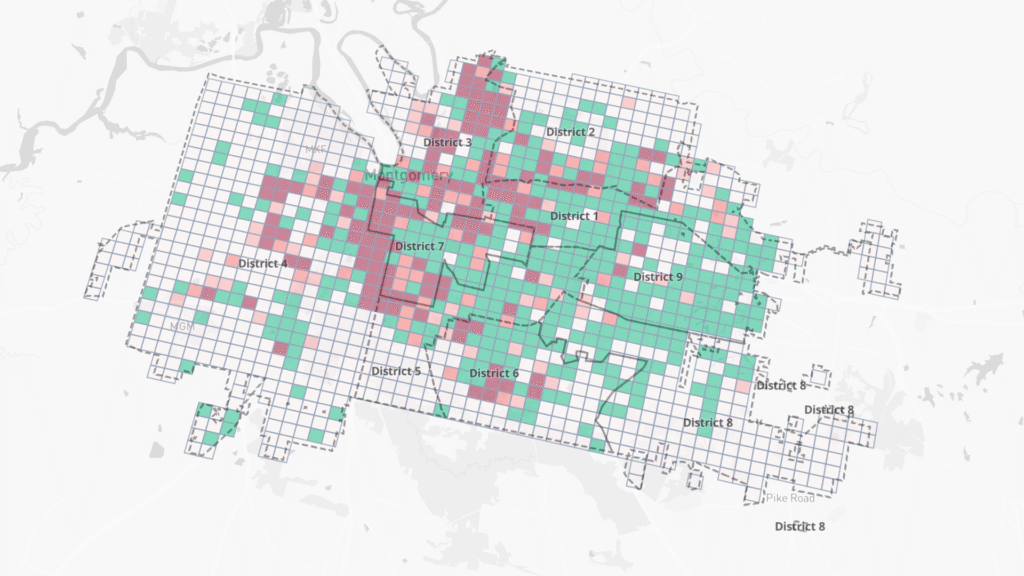
Blight Risk Heatmap (UBS)
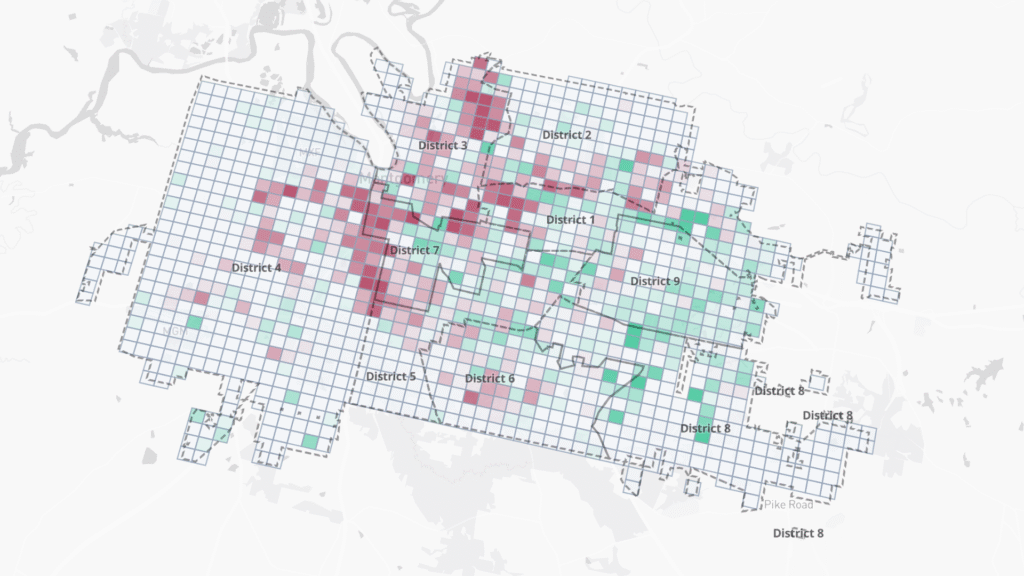
The Unified Blight Score color-codes districts by their probability of physical decline — correlating 311 requests, building permits, and code violations against historical patterns. It surfaces “invisible” degradation 30 days before it becomes critical.
02
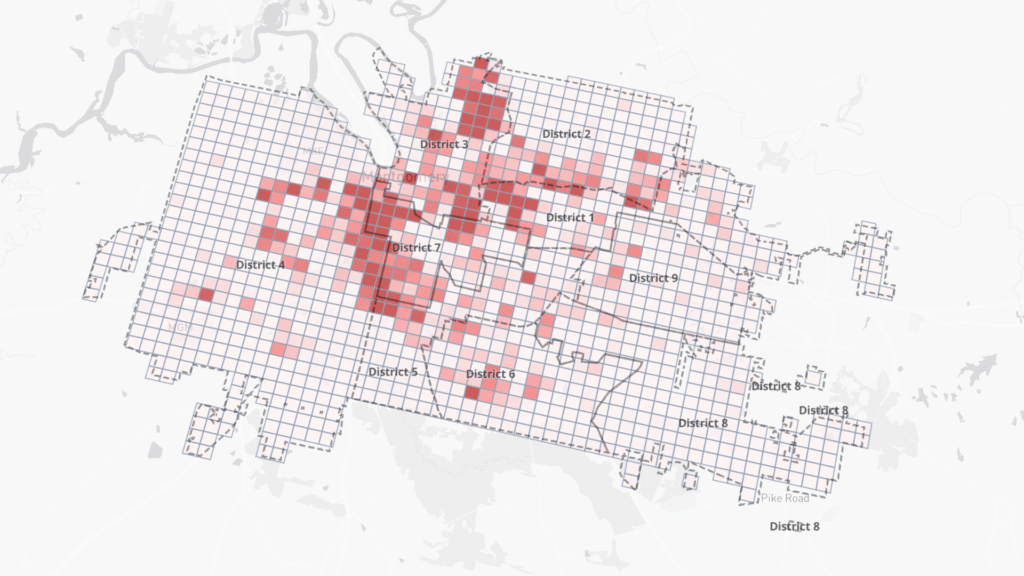
Sentiment Density & Hotspots
This layer maps the city’s social heartbeat — clustering real-time public discourse from social media, news, and community forums into geographic hotspots. It reveals localized zones of frustration or satisfaction that raw statistics miss.
03
Sentiment Gap — Early Warning
The most innovative layer: it flags areas where public sentiment drops sharply while official 311 reporting stays low. These “sentiment gaps” are early warnings of hidden crises — letting the city step in before a situation escalates and trust is lost.
Global reach
Where builders joined from
Participants joined from 100+ countries, showing the global reach of the GenAI.Works community. Top participating regions:
Who built
Built by every skill level
The hackathon was designed to be accessible to builders of all levels — from first-timers exploring AI to ten-year veterans. Distribution of coding experience across participants:
Under the hood
Key innovations
Unified Blight Score
A dynamic predictive model that forecasts neighborhood degradation 30 days out — blending behavioral indicators (live sentiment) with physical ones (permits, violations, 311 logs).
Geospatial intelligence
A high-performance 3D interactive map of the city’s heartbeat. Officials toggle layers of property data, crime stats, and live sentiment to see where physical and social health diverge.
Social Pulse engine
Bright Data’s Web Unlocker scrapes hyper-local discourse from Reddit and regional news without being blocked; NLTK-driven sentiment analysis turns it into actionable points on the map.
Demo
See V.I.B.E. in action
1st Place Worldwide ✦ 350+ Teams ✦ 2,970+ Builders ✦ 100+ Countries ✦ Predictive Urban Intelligence ✦ AI Digital Twin
1st Place Worldwide ✦ 350+ Teams ✦ 2,970+ Builders ✦ 100+ Countries ✦ Predictive Urban Intelligence ✦ AI Digital Twin
1st Place Worldwide ✦ 350+ Teams ✦ 2,970+ Builders ✦ 100+ Countries ✦ Predictive Urban Intelligence ✦ AI Digital Twin
Built in a weekend. Judged best in the world.
V.I.B.E. is one of the systems we build at CurrentSky. Explore the rest.